Digital Marketing, Metrics
This post first appeared on Law Technology Today.

Sometimes understanding the real results that digital marketing efforts drive for law firms is easier said than done. Whether you manage your firm’s marketing efforts in-house, outsource them to an agency, or a combination of both, a lack of proper attribution and reporting can make it harder for your firm to plan your budgets and business growth goals.
It can also make it harder to actually grow your business. When your phone is ringing off the hook, you should understand the driving force behind it so you can invest appropriately. Maybe you tried a new marketing tactic that isn’t working so well. It happens. A strong KPI (key performance indicator) report allows you to immediately recognize the shortcoming and either pull back investment or re-adjust the strategy.
We’ve seen firms who are on the forefront of marketing technology fall short when it comes to measuring the results of their marketing campaigns. Usually this is due to lack of bandwidth or the absence of accurate call tracking services.
Without a strong report, it becomes difficult to make strategic marketing decisions. Consider the following example: it’s common for law firms to want to pull back spending on paid search as their organic search presence increases—why pay for leads when you can get them through organic search, right?
However, we often see that reducing spend in paid search also has a negative effect on leads generated by other digital marketing tactics. Digital marketing vehicles have a great deal of influence on each other. Firms who have a deep understanding of their marketing analytics will be able to make smarter decisions about investments, rather than pursuing marketing efforts based on a more qualitative or “gut feeling” about what’s working or what’s not.
For a law firm of any size, a robust marketing KPI report is simply a must-have if you want to grow your business in the most profitable manner.
Your reporting should make it easy to answer the following questions:
- How many leads did my website generate?
- How does that compare with the previous month and year?
- What channels are driving the most qualified leads?
- How are potential clients contacting our firm?
- What content on my website performs the best?
Using Google Data Studio
At Postali, we’ve recently migrated our clients’ KPI reporting to Google Data Studio and could not be happier with its capabilities in producing usable law firm marketing reports.
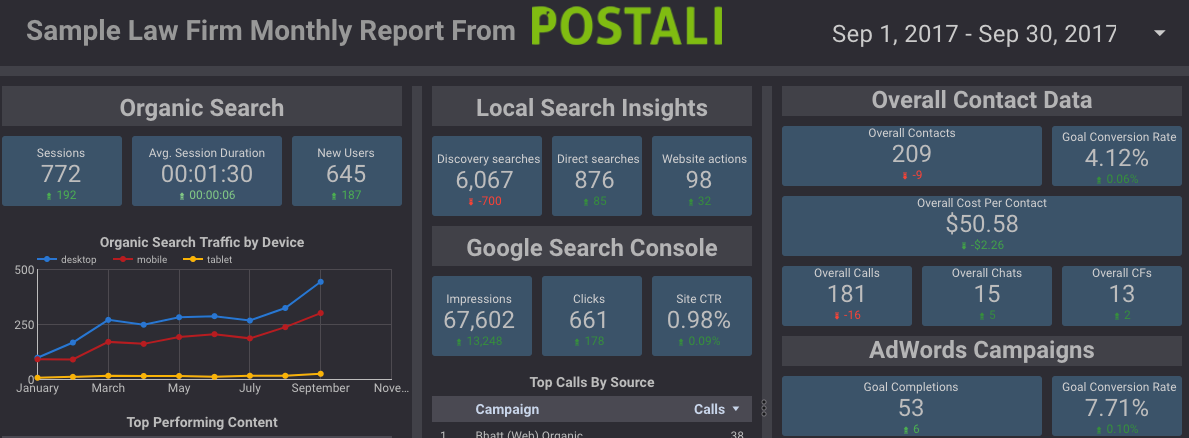
Click here for a sample report
Google Data Studio is a fully customizable reporting solution that turns your raw data into easy-to-read dashboards. The benefits of using this solution include:
- Fully customizable and easy integrations with Google Analytics, Search Console, YouTube, AdWords, and Google Sheets
- Once a report is created, all you have to do is change the date range and it will populate the data automatically. For Postali, this has allowed us to significantly cut down the time spent on pulling data each month. If you can streamline this process for your marketing team, it allows them to focus more on strategy and execution, which will benefit your firm.
- Easy to share and edit. If you work with an agency but handle some marketing in-house, this is an easy way to share and merge data.
- Visually appealing. You can customize the look and feel to match your law firm’s logo and branding.
It’s a Google product, which means you can expect them to iterate and improve over time. We expect to see more integrations and capabilities introduced over time.
Setting a KPI Strategy
Before getting started, it’s important to take a step back and set goals for what you want your law firm’s marketing reports to accomplish. With Google Data Studio, the possibilities are endless, but you don’t want to overcrowd your reporting with meaningless numbers.
Some KPIs to consider are:
- Organic search traffic.
- You will have to define what this means for your firm. One way to define a conversion is a phone call, live chat (if you have this on your website) or filling out a contact form. You will want to configure these in Google Analytics.
- Top-performing landing pages. This will help you improve your content strategy.
- Cost per lead. This will depend on where your marketing investments are. If you have in-house SEO, you may consider your cost to be just overhead. Firms who outsource SEO should consider measuring the ROI based on the agency costs and results they drive. Costs per lead can be calculated for almost all digital marketing channels.
- Local search insights (this reflects how well your firm is performing in the “map pack” listings that appear in Google above traditional organic listings.)
Google Data Studio creates visually appealing data visualization, but learning all of its capabilities takes some time. Before building a report, the person building the report needs to have the following:
- Access to Google Analytics and a working knowledge of the platform
- Access to any other data that will be included in the report, including Google Sheets, AdWord, and Search Console
It’s also a good idea to review Google Data Studio’s video tutorials before starting.
Once the strategy is in place and the proper access has been granted, building reports is a two-part project that involves linking data sources and building out the report.
Linking Data Sources
Once you are logged in to Google Data Studio, you want to first link all of the data sources you want to use. Technically, you can do this at any point in the process, but we’ve found it’s easier to link them all at the beginning.
- On the left-hand side of the dashboard, click Data Sources.
- Click the + button on the bottom right of the screen.
- Choose which type of data source you want to connect. When you do this, Google will automatically display any properties you have access to.
- Click Connect.
- You will be taken to a screen that displays every KPI available in that report. You can remove any field you want, but we recommend just leaving it as is and clicking Create Report.
- From the Report Screen, you can get back to Step 1 by clicking Resources à Manage Added Data Sources. Complete this process from every data source.
Creating the Report
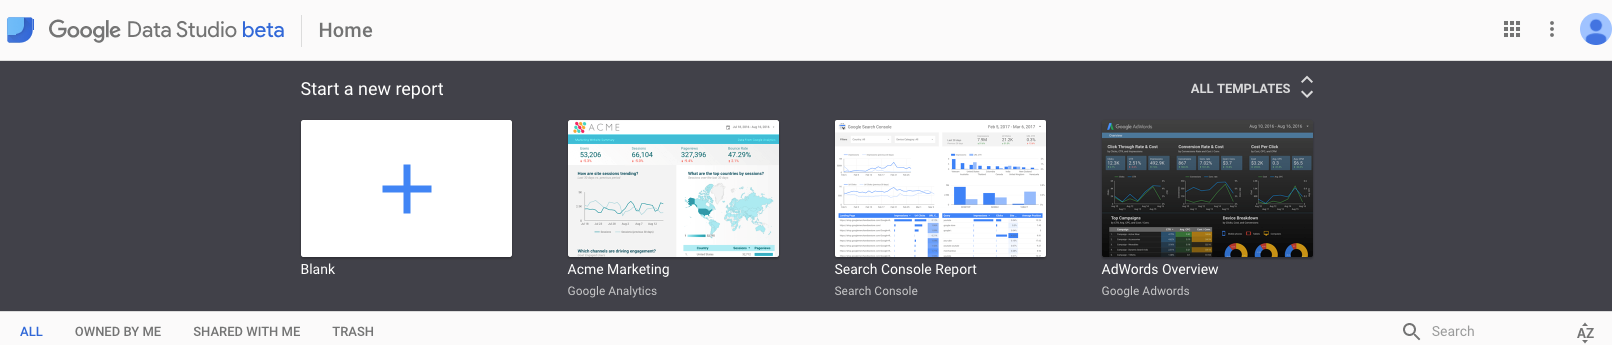
You can create a report with a blank template. However, we recommend starting with a template and modifying it to fit your needs. This saves you time in crafting a perfect design.
-
- From the Home screen, select a template or choose a blank template to create your report.
- From here, the top navigation gives you all the options you need. You can adjust the layout and theme and choose which types of charts or metrics you want to include.
- When you select a data point to add, use the Data and Style options on the right to customize your data. Data allows you to adjust which metrics you are displaying. You can also select if you want to display the previous month or year’s data for comparison. Style allows you to adjust fonts, colors and your data labels.
- When you’re finished, you can adjust your sharing settings. You can share your report in View-Only and Edit-Only formats to the people who need access.
- You’re done! Once the report is created, all you have to do in the future is adjust your date ranges and it will automatically populate.
A few additional tips in creating the perfect report for your firm:
- Focus on the KPIs that really matter. More website traffic doesn’t always mean your firm will get more leads. Similarly, a drop in traffic may not be as problematic as it appears. Conversions—phone calls, live chats, contact forms, are the most accurate indicators of success. We also like to filter traffic to exclude out-of-state traffic, since they have little likelihood of converting into qualified leads.
- Don’t overdo it on a monthly basis. A one or two-page report should be enough to give your marketing team and the firm’s owner(s) a clear direction.
- Overdo it once or twice a year, though. Create a robust report that you can use to dive deep into each marketing vehicle you’re leveraging. This is the report you want to use to make larger decisions on investments and your law firm’s marketing strategy.
- Add a glossary if your audience is not familiar with marketing KPIs.
- Google Data Studio is the best tool on the market for creating streamlined reporting that will help your firm make smarter marketing decisions. There are also many other applications for the tool as well. You could create reports on client referrals, operational expenses or anything else that you would normally use a spreadsheet for.
Once your report is created, spend time each month reviewing it and discussing the insights with whoever handles your marketing. The most successful law firms are those who are open to testing new marketing ideas, but remain committed to properly reporting and analyzing the results.